Pay Bill Here - Fast and Convenient
BVIEC’S MONTHLY FUEL DATA – APRIL 2026
Tortola, British Virgin Islands, May 29, 2026 — April 2026 delivered a month of contrasts, one that requires careful reading to fully appreciate.
On the surface, the headline figures tell a challenging story. The ongoing conflict between the United States and Iran, and the continued closure of the Strait of Hormuz, drove the average price of fuel to $4.096 per gallon in April, a new all-time record, surpassing even March’s historic high. BVIEC’s total fuel bill climbed to $5.1 million, the highest single-month expenditure on record for the Corporation.
Yet despite those records, customers paid less in fuel surcharge in April than they did in March. Understanding why requires looking beyond the headline numbers.
Two important factors shaped April’s data. First, February’s billing cycle, which is the shortest of the year at just 28 days, partially influenced March’s figures, resulting in fewer billable days and lower recorded consumption in that month. April’s billing period, which captures March’s full 31 days, brought those additional days back into the data, contributing to the increase in units sold and spreading production costs across more kilowatt-hours. Second, BVIEC implemented necessary cost-containment measures to sustain operations under mounting financial pressure. Together with the continued Government of the Virgin Islands’ $1,000,000 emergency fuel subsidy, now in its second month, these factors combined to lower the net surcharge to customers month over month.
However, this positive outcome must be understood fully and honestly. The cost-containment measures that contributed to it have not come without consequence. Out of necessity, BVIEC has increasingly been forced to rely on credit from partners and to defer or cancel essential maintenance and replacement of critical plant and equipment. While these steps help manage immediate costs, they are not a long-term solution and place a growing strain on the Corporation’s ability to maintain reliable service across the Territory.
The full breakdown of what April cost, what drove those costs, how customers were protected, and the broader operational context behind the numbers is presented transparently in the seven sections below.
AT A GLANCE — APRIL 2026 (7 Categories)
1) Total Fuel Cost: $5,125,133
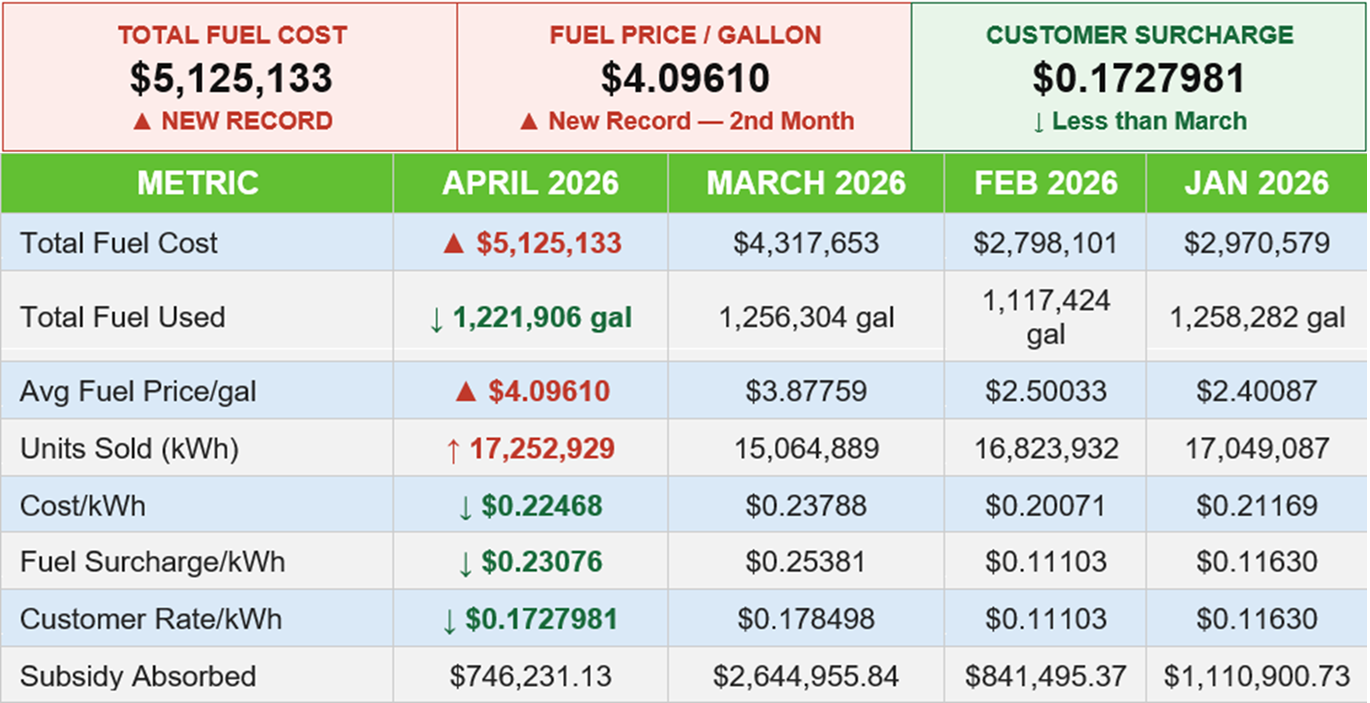
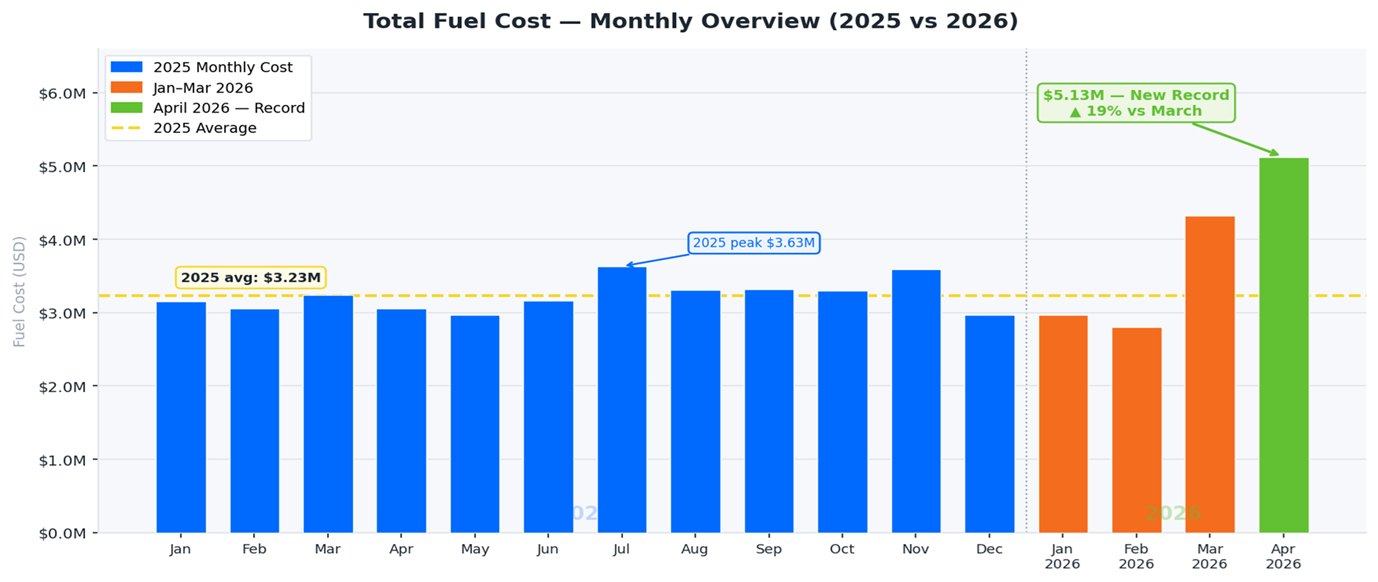
(March: $4,317,653 | February: $2,798,101 | January: $2,970,579 | 2025 Peak July: $3,630,979)
What it Means:
April’s total fuel bill of $5.1 million is the highest single-month fuel expenditure BVIEC has recorded in recent years, surpassing even March’s unprecedented figure by over $800,000. This is now two consecutive months of record-breaking fuel costs, driven entirely by the continued disruption to global oil supply. Crucially, this cost increase was driven purely by price and not by wasteful consumption, as April used less fuel than March while generating significantly more electricity.
Why it Matters:
The $5.1 million price tag is a stark illustration of the Territory’s exposure to global commodity markets. Every month that the Strait of Hormuz remains disrupted, the BVI absorbs costs that have nothing to do with local decisions or consumption patterns. This is exactly why long-term energy security through diversified generation and reduced dependence on imported fuel is not just an aspiration but an economic necessity.
Relatable Example:
BVIEC spent approximately $170,800 on fuel daily in April, nearly $7,117 every hour. That is $31,800 more per day than March, and more than double January and February’s daily spend.
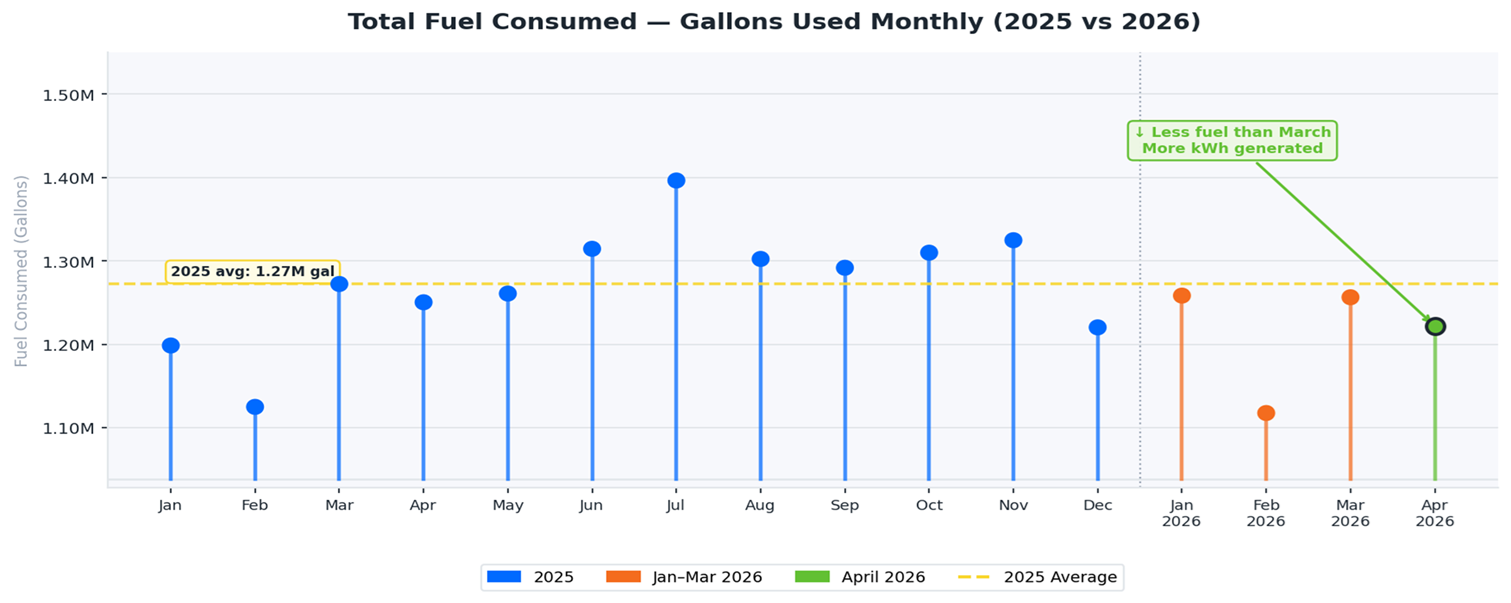
2) Total Fuel Used: 1,221,906 gallons
(March: 1,256,304 gal | February: 1,117,424 gallons | January: 1,258,282 gallons)
What it Means:
April consumed fewer gallons of fuel than both January and March, despite selling significantly more electricity than in March. This is a genuinely encouraging operational signal: BVIEC generated more kilowatt-hours per gallon of fuel in April than in any other month of 2026 so far. On its face, this reflects an improvement in the output achieved per gallon of fuel consumed. However, this must be understood in the context of the broader operational realities that BVIEC continues to navigate.
Why it Matters:
The reduction in fuel consumption reflects not only genuine operational performance, but also necessary cost-containment measures adopted to sustain operations amid mounting financial pressures. The lower fuel consumption figure, while positive on the surface, cannot be viewed in isolation from the financial and operational pressures that shape every decision BVIEC makes.
Relatable Example:
In March, BVIEC needed roughly 1 gallon to generate 11.99 kWh. In April, that same gallon produced 14.12 kWh, nearly 2 extra kilowatt-hours per gallon. Across 1.22 million gallons, that gain is equivalent to generating an extra 2.6 million kWh.
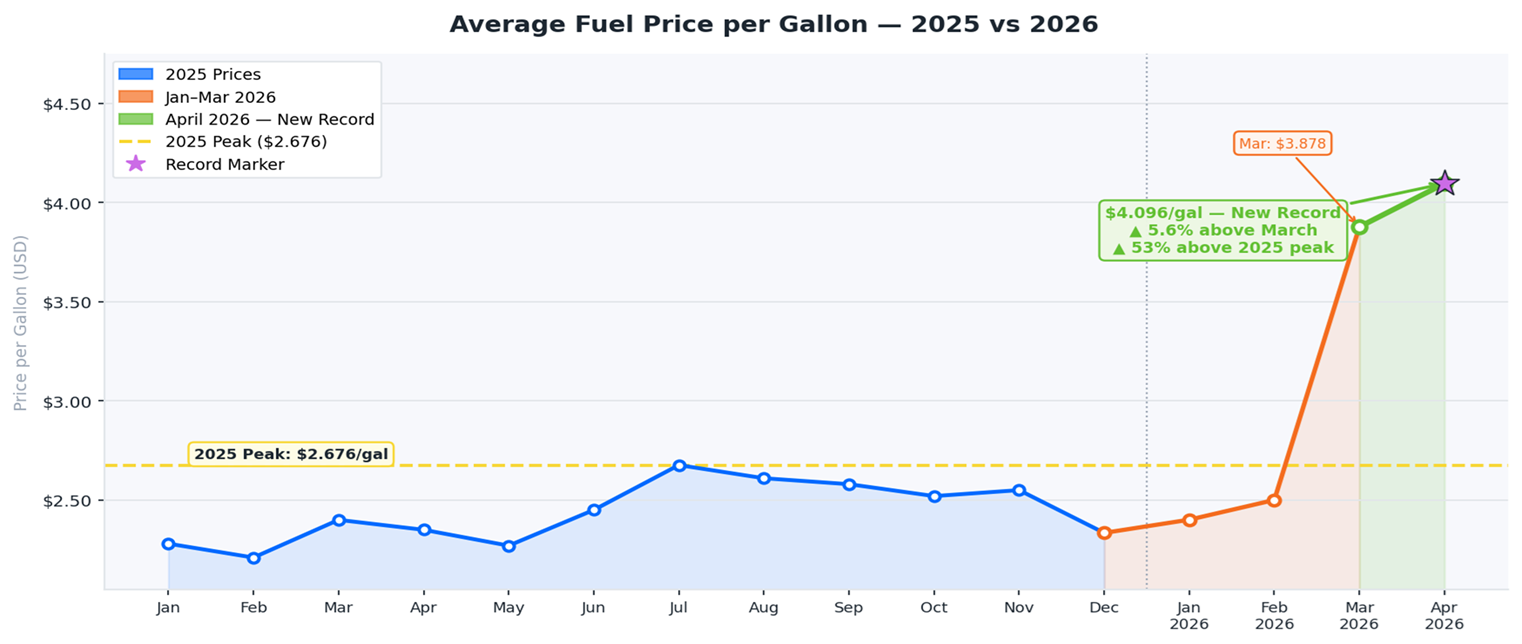
3) Average Fuel Price: $4.09610 per gallon
(March: $3.87759 | February: $2.50033 | January: $2.40087 | 2025 Highest: $2.67625)
What it Means:
The average fuel price in April reached $4.09610 per gallon, a new all-time record and the second consecutive month of historically high prices. This is 5.6% above March’s already-record figure, 53% above the highest price seen throughout all of 2025, and nearly double what was typical in early 2026 before the Strait of Hormuz closure. For two months running, the Territory has been purchasing fuel at prices with no precedent in recent history.
Why it Matters:
Every cent increase in global fuel prices shows up directly in what it costs to power the BVI. At over one million gallons per month, even small per-gallon movements create enormous cost swings.
Relatable Example:
April’s price of $4.096 per gallon is $1.696 higher than January 2026. Multiplied across 1.22 million gallons, the difference in fuel cost between January’s price and April’s is $2.07 million in a single month. That is the financial gap created by one geopolitical event on the other side of the world.
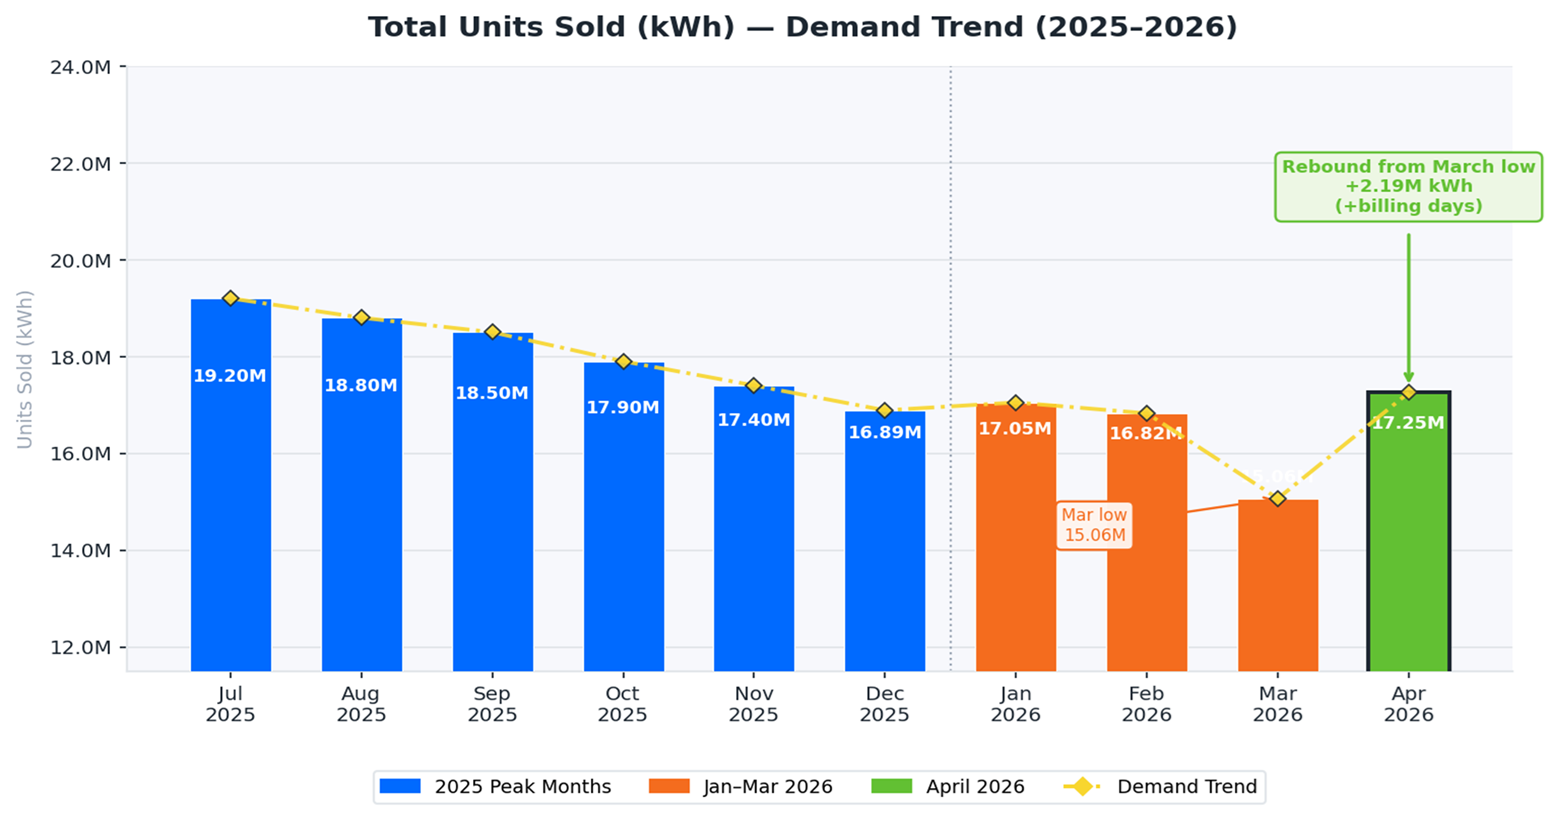
4) Total Units Sold: 17,252,929 kWh
(March: 15,064,889 kWh | February: 16,823,932 kWh | January: 17,049,087 kWh)
What it Means:
April saw a strong rebound in electricity demand, up by 2.19 million kWh compared to March and slightly above January. However, part of this increase is linked to the billing cycle. March’s figures partially reflected February, the shortest month of the year, which naturally captured fewer billing days and lower consumption. April’s data reflected March’s full 31-day billing cycle, resulting in more consumption days being recorded.
Why it Matters:
This means the increase was influenced not only by electricity demand, but also by the longer billing period. The figures should therefore be viewed within the context of billing cycles, customer usage patterns, and BVIEC’s continued cost-management efforts.
Relatable Example:
Imagine you are paid weekly and one month you receive three pay cheques, while the next month you receive four. Your salary has not changed, your hours have not changed, but the four-cheque month will always look bigger on paper. The same logic applies here. March’s data was shaped by February’s 28-day cycle. April’s data reflects March’s 31-day cycle.
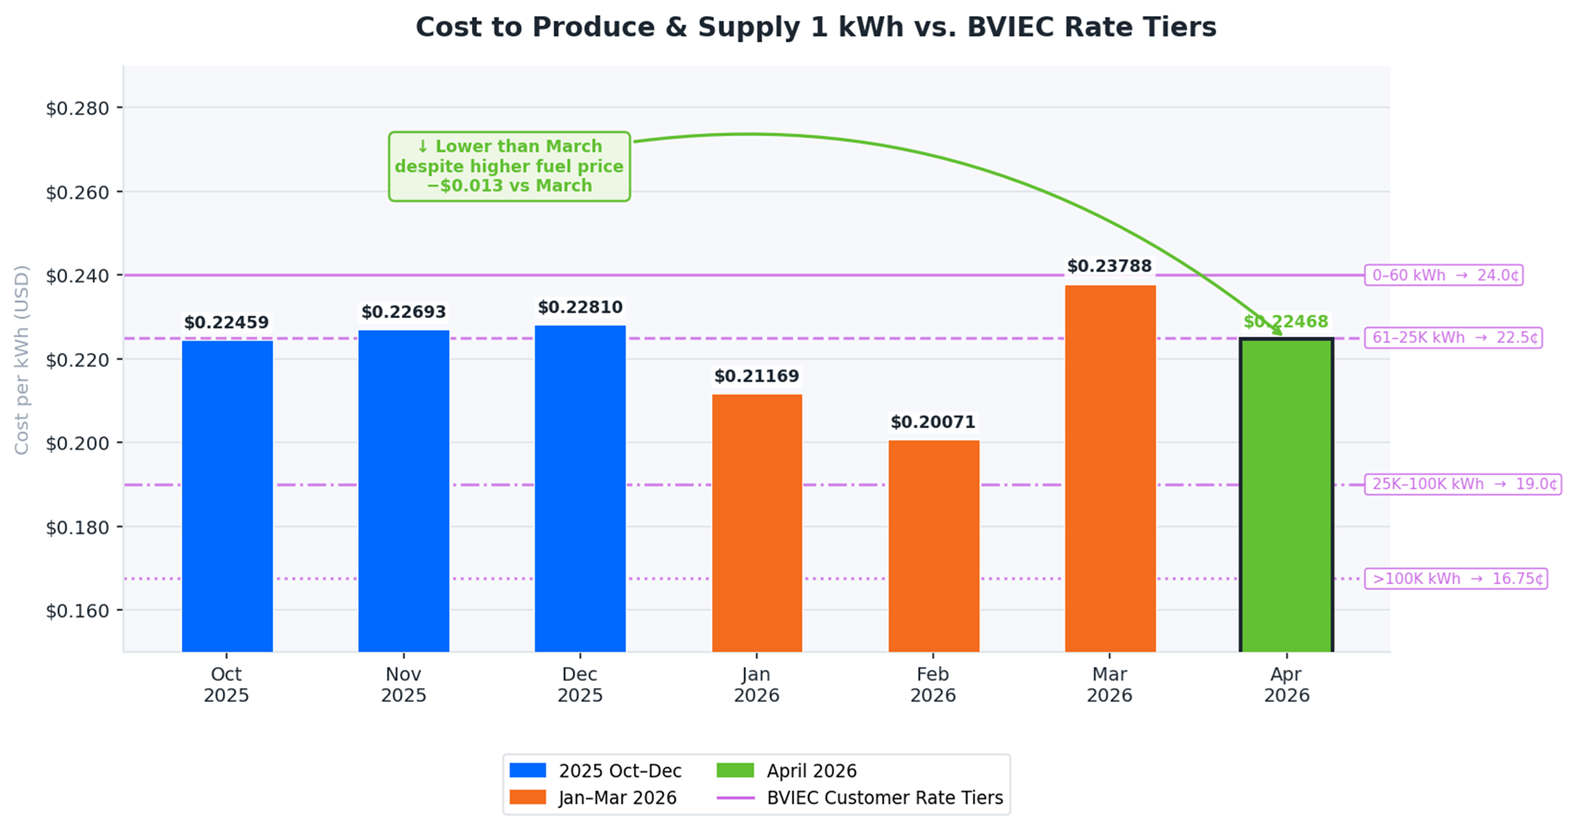
5) Cost to Produce & Supply 1 kWh: $0.22468
(March: $0.23788 | February: $0.20071 | January: $0.21169 | 2025 Range: approx. $0.22–$0.23)
What it Means:
Despite fuel prices setting a new record in April, the cost to produce and supply each kilowatt-hour fell by $0.0132 compared to March, from $0.23788 to $0.22468. This is a product of the fuller billing cycle, increasing the total kWh across which production costs are distributed, combined with the cost-containment measures BVIEC has implemented under financial pressure. As a result, the per-unit cost is brought closer to the levels seen across most of 2025, even while fuel prices are dramatically higher.
Why it Matters:
Picture a landlord locked into 1978 rental rates while repair, insurance, utility, and maintenance costs continue rising for decades. Eventually, the rent no longer covers the true cost of maintaining the property. Repairs get delayed, pressure builds, and long-term reliability becomes harder to sustain. BVIEC’s rate structure places it in exactly that position. The lower cost-per-kWh in April is a reprieve, not a resolution. The structural gap between production cost and recovery remains and the longer it persists, the greater the long-term risk to reliable service.
Relatable Example:
April’s $0.22468 per kWh production cost means the Corporation spent $224.68 to generate 1,000 kWh. A large customer paying the lowest tier rate contributed only $167.50 toward that. The remaining $57.18 per 1,000 kWh came out of BVIEC’s already-strained finances. Multiplied across millions of kilowatt-hours every month, that gap is not a rounding error, it is a structural financial crisis in slow motion.
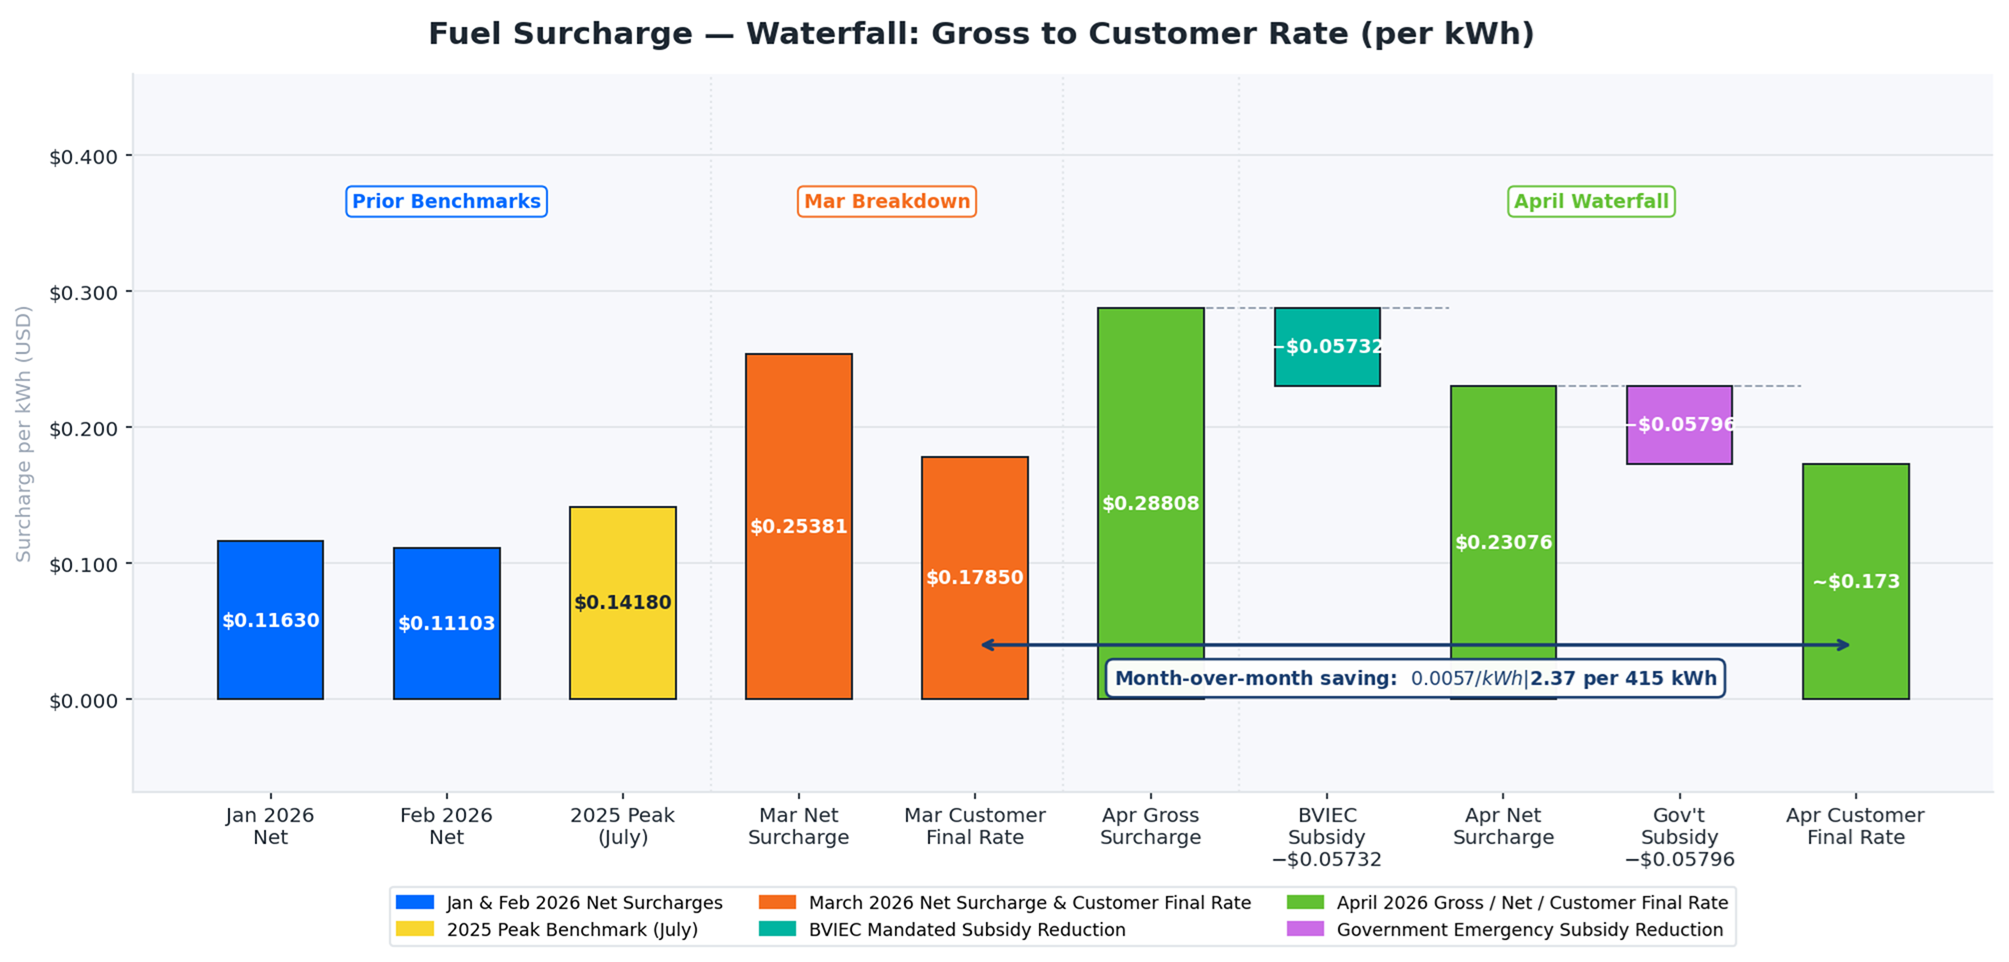
6) Fuel Surcharge: $0.23076 per kWh
(March: $0.25381 | February: $0.11103 | January: $0.11630 | Gross before BVIEC subsidy: $0.28808)
What it Means:
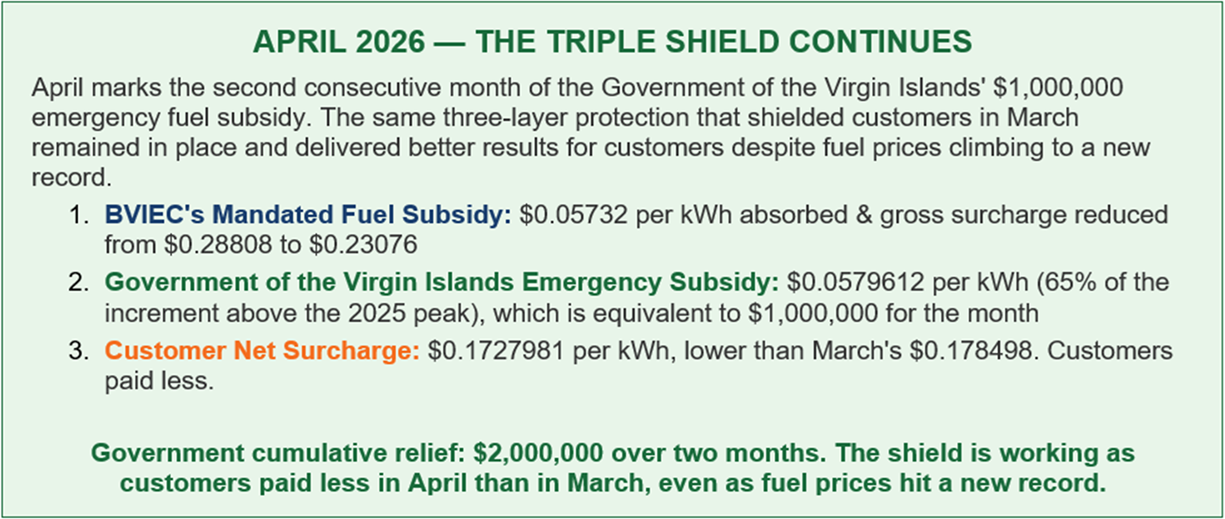
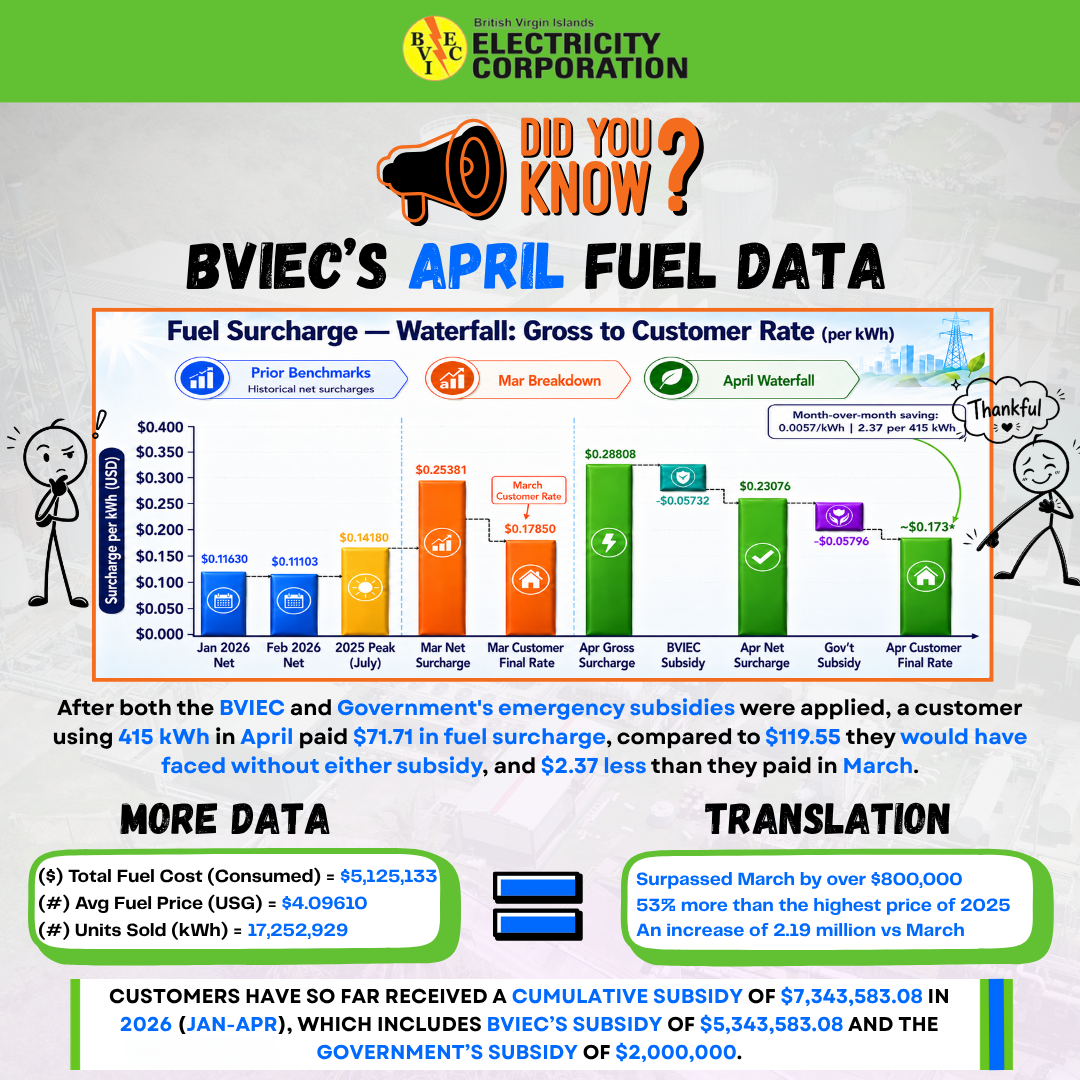
The net fuel surcharge for April, after BVIEC’s mandated subsidy is applied, was $0.23076 per kWh. This is lower than March’s $0.25381, despite fuel prices being higher. Without BVIEC’s subsidy, the surcharge would have been $0.28808 per kWh. Then with the Government of the Virgin Islands second month of emergency relief covering $0.0579612 per kWh, it brought the final customer fuel surcharge rate down to $0.1727981.
Why it Matters:
The fuel surcharge is the most direct link between global energy markets and every customer’s bill. Its reduction from March to April, despite a higher fuel price, demonstrates that the overall system is providing meaningful protection to customers during the most challenging fuel price environment the BVI has faced.
Relatable Example:
After both the BVIEC subsidy and the Government’s emergency contribution were applied, a customer using 415 kWh in April paid $71.71 in fuel surcharge, compared to $119.55 they would have faced without either subsidy, and $2.37 less than they paid in March.
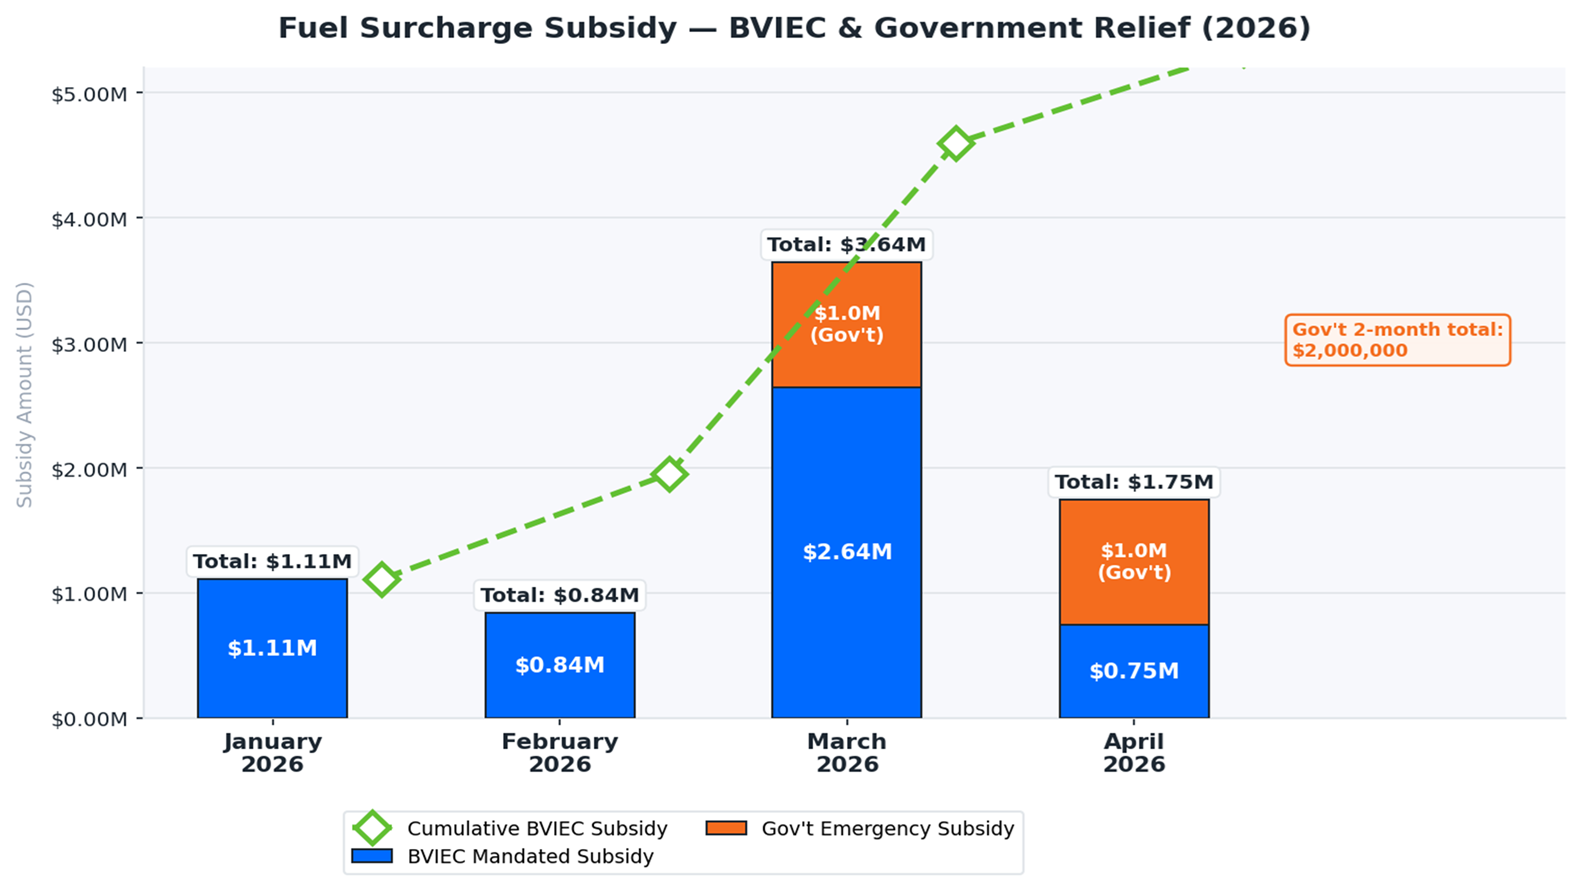
7) Fuel Surcharge Subsidy: $746,231.13
(March: $2,644,955.84 | February: $841,495.37 | January: $1,110,900.73 | Jan–Mar 2026 Total: $4,597,351.94)
Jan–Apr 2026 Cumulative BVIEC Subsidy: $5,343,583.08 | Government 2-Month Total: $2,000,000
What it Means:
BVIEC absorbed $746,231.13 in fuel surcharge subsidy in April, the lowest monthly figure of 2026 so far. This reflects the impact of the fuller billing cycle increasing total kWh generated and distributed, which in turn reduces the per-unit gap between production cost and recovered surcharge. The Corporation’s cumulative subsidy absorbed from January through April 2026 now stands at $5,343,583.08.
April is the second month of the Government of the Virgin Islands’ $1,000,000 emergency subsidy, covering $2,000,000 over the past two months.
Why it Matters:
The subsidy structure continues to function as its architects intended. BVIEC’s mandated relief absorbs one layer of the fuel cost pressure before it reaches customers. The Government’s emergency subsidy absorbs another. Together, they have ensured that, through two consecutive record-breaking fuel price months, the customer-facing surcharge has actually moved downward. This is meaningful, tangible protection, but it is also financially costly, and the broader financial pressures on BVIEC reinforce the urgency of long-term structural reform.
Relatable Example:
In April, BVIEC absorbed $746,231.13 and the Government contributed $1,000,000, a combined $1.75 million in relief for the month. The four-month BVIEC cumulative total of $5.34 million, combined with the Government’s $2 million over two months, means over $7.3 million in total relief has been channelled to protect BVI customers since January 2026.