


Pay Bill Here - Fast and Convenient
BVIEC’S MONTHLY FUEL DATA – MARCH 2026
Tortola, British Virgin Islands, April 29, 2026 — March 2026 stands apart from every month that came before it. What began as a relatively stable year for fuel costs was upended in a single month by a geopolitical crisis thousands of miles away, the closure of the Strait of Hormuz following the escalation of conflict between the United States and Iran. That narrow waterway, through which nearly one-fifth of the world’s daily oil supply passes, effectively shut down, sending global fuel prices surging to levels the British Virgin Islands had never experienced in recent memory.
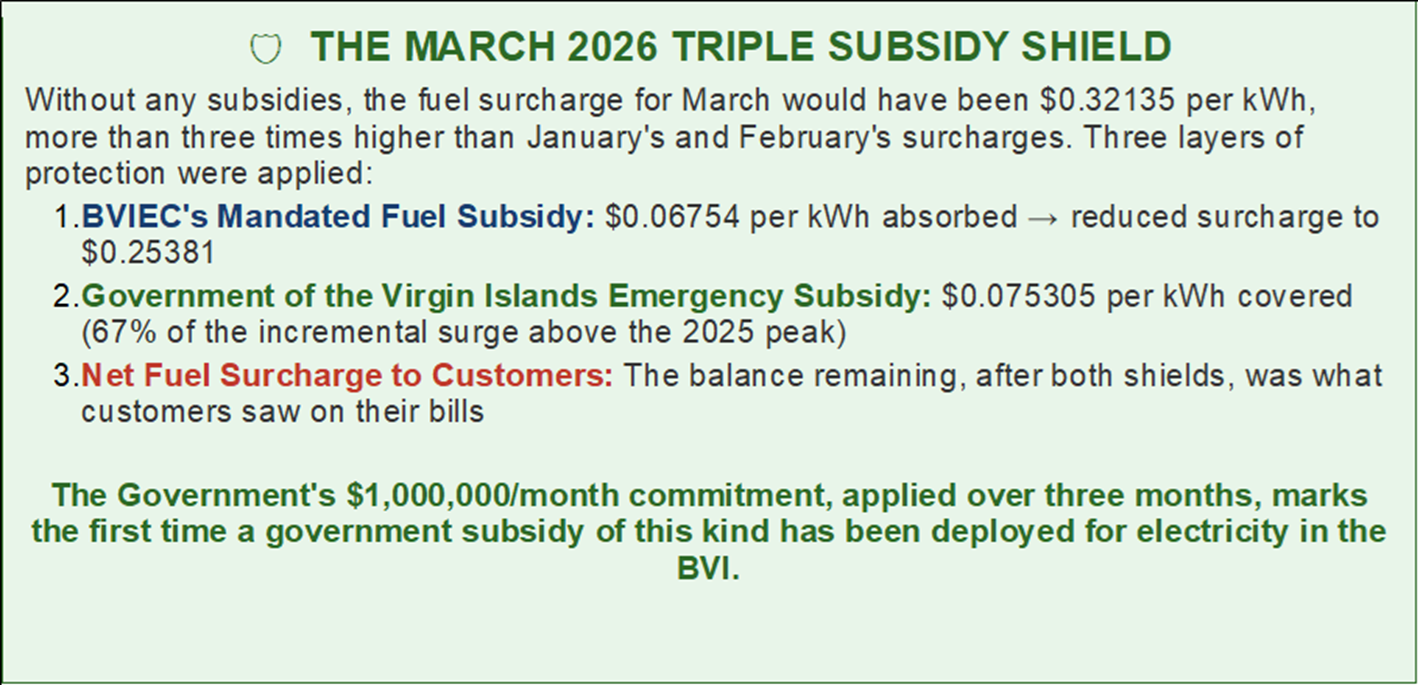
What follows is a transparent, data-driven account of what March cost, what drove those costs, and what was done to shield residents and businesses from the full force of that burden. In an unprecedented show of support, the Government of the Virgin Islands stepped in alongside BVIEC’s own longstanding fuel subsidy to provide emergency relief for a period of three months, deploying a combined protection of over $3.6 million in March alone.
Here’s what the numbers mean.
AT A GLANCE — MARCH 2026 (7 Categories)
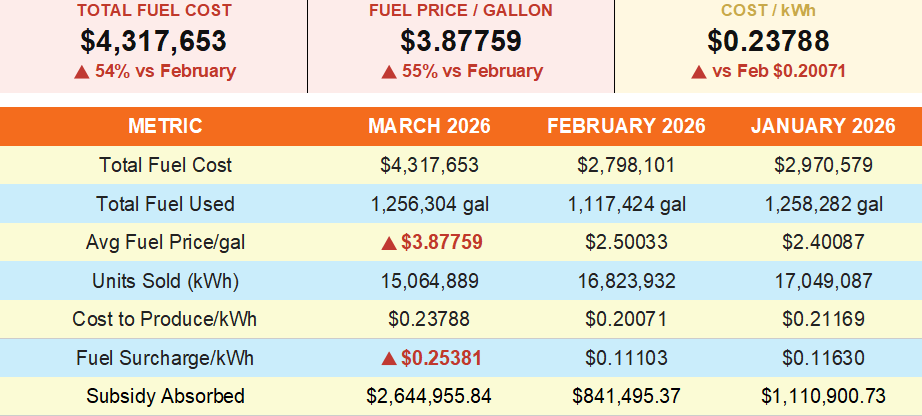
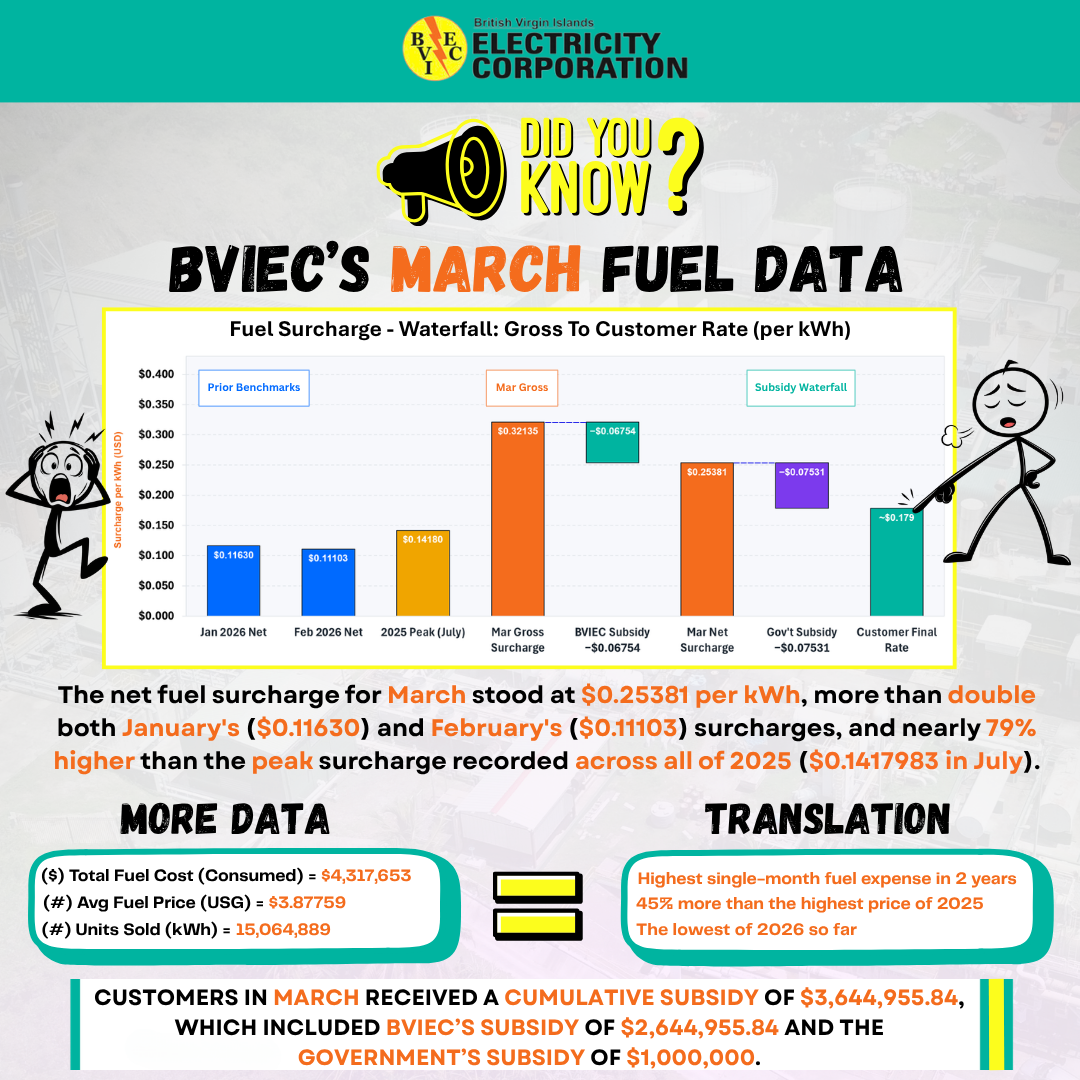
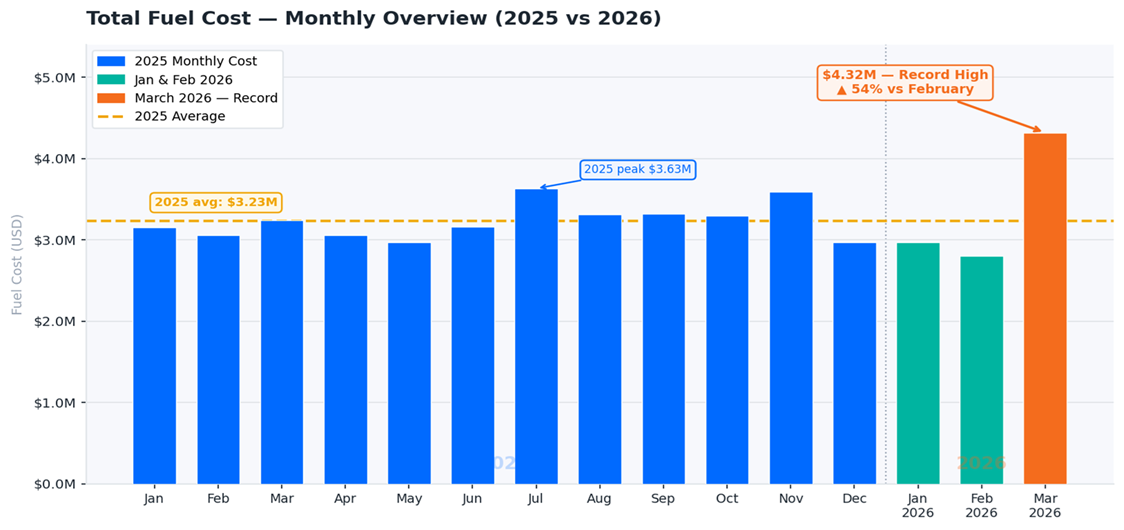
1) Total Fuel Cost: $4,317,653
(February: $2,798,101 | January: $2,970,579 | 2025 Monthly Peak: $3,630,979 in July)
What it Means:
BVIEC’s total fuel bill for March surged past $4.3 million, the highest single-month fuel expenditure seen in at least two years. This represents a staggering $1.5 million increase (54%) above February’s cost, despite using a similar volume of fuel. Every cent of that increase traces back to one source: the historic price spike triggered by the Strait of Hormuz closure. Even July 2025, which was the most expensive fuel month of last year, sat more than $686,000 below March’s cost.
Why it Matters:
The BVIEC’s Henry Wilfred Smith Power Station generates all of its electricity from diesel fuel. When global oil markets are disrupted, even by events thousands of miles away, the cost to keep the lights on here escalates immediately. This is the financial fragility that BVIEC and the Territory face every single day. There is no buffer, no alternative fuel source, and no escape from a global price shock when you depend entirely on imported diesel.
Relatable Example:
BVIEC spent approximately $139,000 on fuel every single day in March. That is nearly $5,800 every hour, more than double what was spent in February ($100,000/day). To put it in perspective, running BVIEC’s fuel operation for just one week in March cost as much as it did for nearly two weeks in any month of 2025.
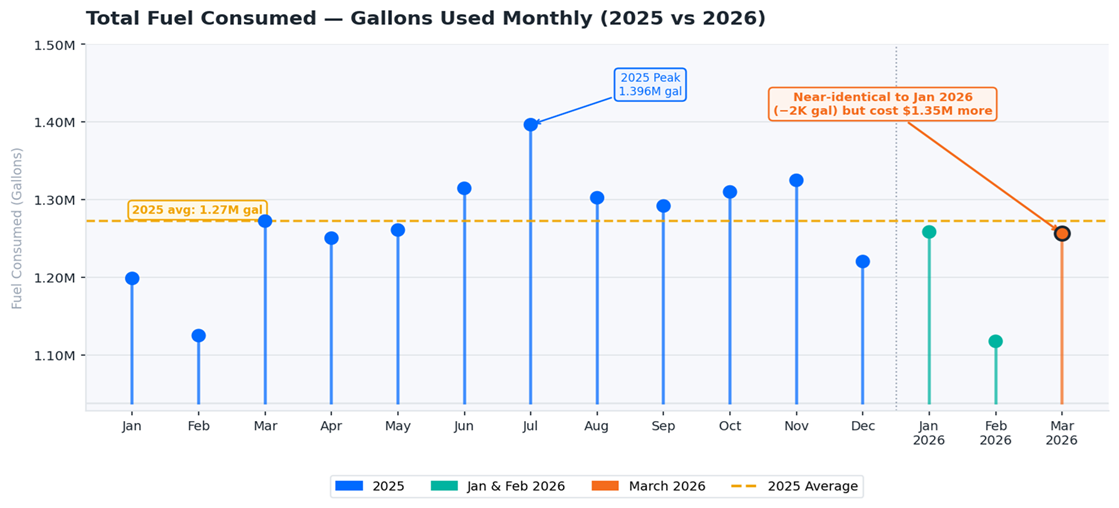
2) Total Fuel Used: 1,256,304 gallons
(February: 1,117,424 gallons | January: 1,258,282 gallons)
What it Means:
March’s fuel consumption was almost identical to January, differing by just under 2,000 gallons, and roughly 139,000 gallons more than February. This tells a clear story: the quantity of fuel burned was not the problem in March. Consumption was broadly in line with what the Territory typically needs to function. The crisis was entirely a price crisis, not a consumption crisis.
Why it Matters:
This distinction matters deeply. When fuel costs spike because the Territory is using dramatically more energy, conservation and efficiency measures can help reduce the burden. But when the spike is purely from price, as was the case in March, there is very little that residents or BVIEC can do on their own in the short term. Price shocks require structural solutions: diversified energy sources, government interventions, and long-term investment in renewables.
Relatable Example:
Imagine filling your car with the same amount of fuel as always, but finding the price per gallon had shot up 55% overnight. Your driving habits did not change, but your fuel bill did. That is precisely what happened to BVIEC in March. The Territory consumed virtually the same volume of fuel as January, yet the bill was over $1.3 million higher.
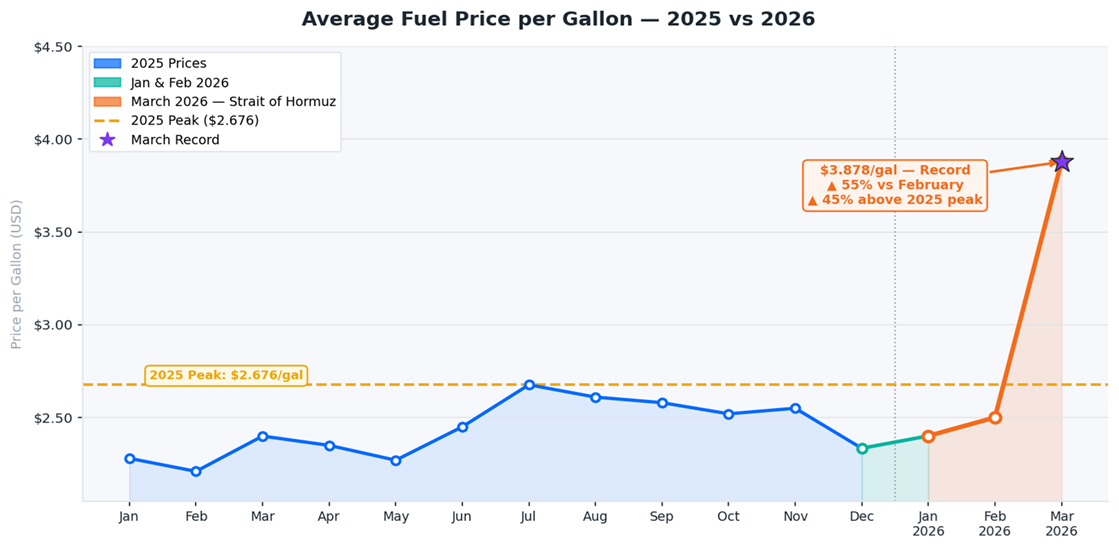
3) Average Fuel Price: $3.87759 per gallon
(February: $2.50033 | January: $2.40087 | 2025 Highest: $2.67625)
What it Means:
The average price of fuel per gallon jumped by $1.38 from February, a 55% increase in a single month. Even more striking, March’s average price of $3.88 per gallon was 45% higher than the single highest price per gallon recorded across all of 2025 ($2.67625). This is not a gradual trend. It is a sudden shock, and it is directly attributable to the global oil supply disruption caused by the closure of the Strait of Hormuz.
Why it Matters:
For a utility that purchases over one million gallons of fuel every month, a $1.38 increase per gallon is catastrophic in the short term.
Relatable Example:
That $1.38 jump, multiplied across 1.256 million gallons, translates to over $1.73 million in additional fuel cost compared to February, generated by price alone, in a single month.
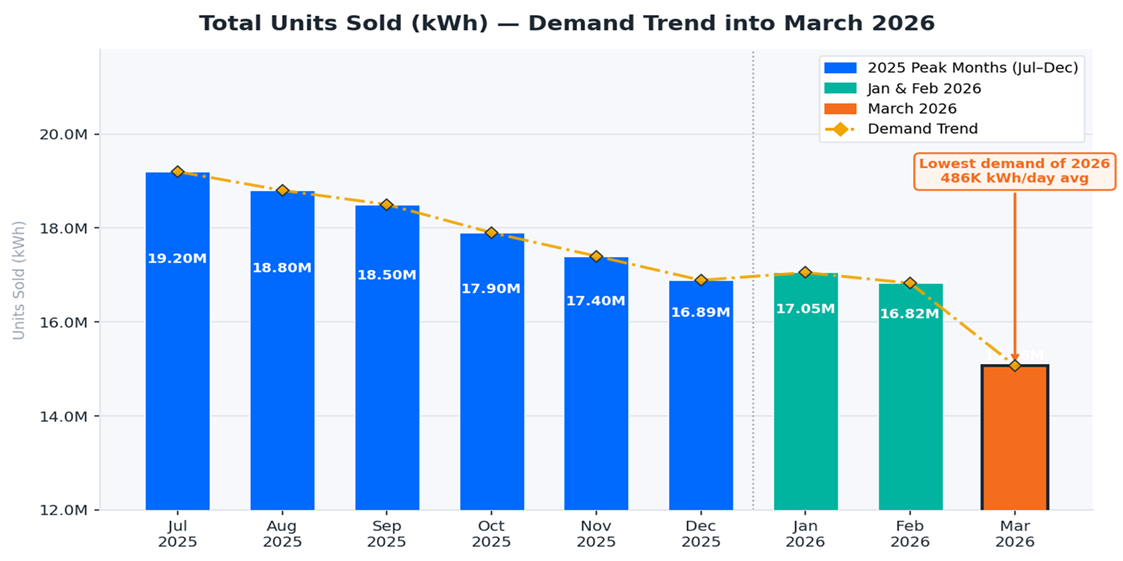
4) Total Units Sold: 15,064,889 kWh
(February: 16,823,932 kWh | January: 17,049,087 kWh)
What it Means:
Electricity demand in March was the lowest of the year so far, about 1.76 million kWh below January and approximately 1.76 million kWh below February as well. And yet, despite this being the lowest-demand month of 2026 to date, BVIEC faced its highest-ever fuel expenditure. Lower demand simply could not offset the unprecedented price spike.
Why it Matters:
Lower demand is generally positive, as it means less fuel consumed and typically lower costs. But in March, every efficiency gain was overwhelmed by the scale of the price increase. This highlights an important structural issue: the Territory’s electricity system is still overwhelmingly price-exposed because it depends entirely on imported diesel
Relatable Example:
Even at its lowest demand month in 2026, March still delivered electricity to over 18,000 customers across the Territory, generating nearly 486,000 kWh every single day.
5) Cost to Produce & Supply 1 kWh: $0.23788
(February: $0.20071 | January: $0.21169 | 2025 Range: approx. $0.22–$0.23)
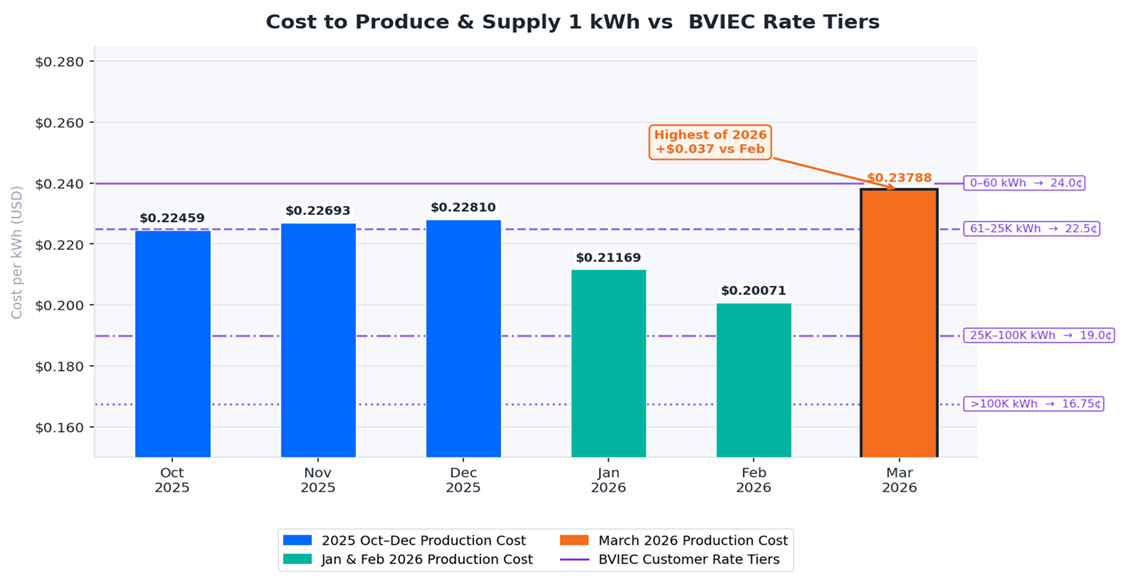
What it Means:
Every kilowatt-hour generated and delivered in March cost BVIEC $0.23788 to produce and supply. That is nearly 3.7 cents more than February and 2.6 cents more than January. While March’s cost per kWh did not spike as dramatically as the fuel price itself, in part because lower demand meant fewer total kWh and cost-containment efforts were maintained, it is still the highest unit production cost recorded in 2026 so far, and it exceeds the average production cost seen across most of 2025.
Why it Matters:
BVIEC’s electricity rates have not changed since 1978. The Corporation charges customers as little as 16.75 cents per kWh for large consumers, while it now costs nearly 24 cents to produce each one. That gap of more than 7 cents, absorbed silently by BVIEC on every unit sold to high-volume customers, is a structural problem that deepens with every external price shock. The fuel crisis of March 2026 has placed this long-standing imbalance under an even harsher spotlight.
Relatable Example:
For every 1,000 kWh generated in March, BVIEC spent $237.88 to produce and deliver it. In February, that same 1,000 kWh cost $200.71, meaning March was $37.17 more expensive per 1,000 kWh, month over month. Some customers pay as little as $167.50 per 1,000 kWh, meaning BVIEC absorbs over $70 of cost for every 1,000 kWh sold to those customers, before subsidies are even factored in.
6) Fuel Surcharge: $0.25381 per kWh
(February: $0.11103 | January: $0.11630 | 2025 Peak: $0.1417983 in July)
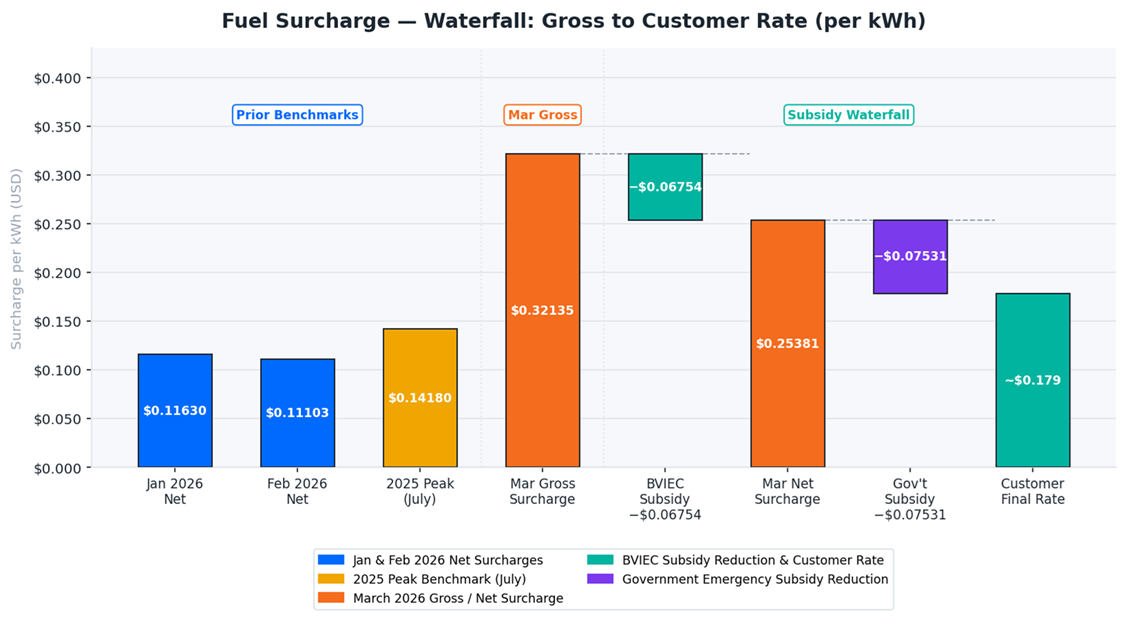
What it Means:
The net fuel surcharge for March stood at $0.25381 per kWh, more than double both January’s ($0.11630) and February’s ($0.11103) surcharges, and nearly 79% higher than the peak surcharge recorded across all of 2025 ($0.1417983 in July). It is critical to understand that this $0.25381 is already the reduced figure, after BVIEC applied its mandated fuel subsidy. The gross surcharge before BVIEC’s relief was an even higher $0.32135 per kWh.
Why it Matters:
The fuel surcharge is the mechanism that connects global fuel price movements directly to customers’ electricity bills. In normal months, it fluctuates modestly, as seen across 2025 and in January and February of 2026. But when a geopolitical crisis disrupts global oil supply overnight, the surcharge reflects that shock almost immediately.
Relatable Example:
For most of 2025 and into early 2026, the fuel surcharge held relatively steady, ranging from about $0.11 to $0.14 per kWh. The fuel surcharge in March was the equivalent of what customers might have expected to see across nearly two full years of gradual increases, compressed into a single billing period.
7) Fuel Surcharge Subsidy: $2,644,955.84
(February: $841,495.37 | January: $1,110,900.73 | Jan–Mar 2026 Total: $4,597,351.94)
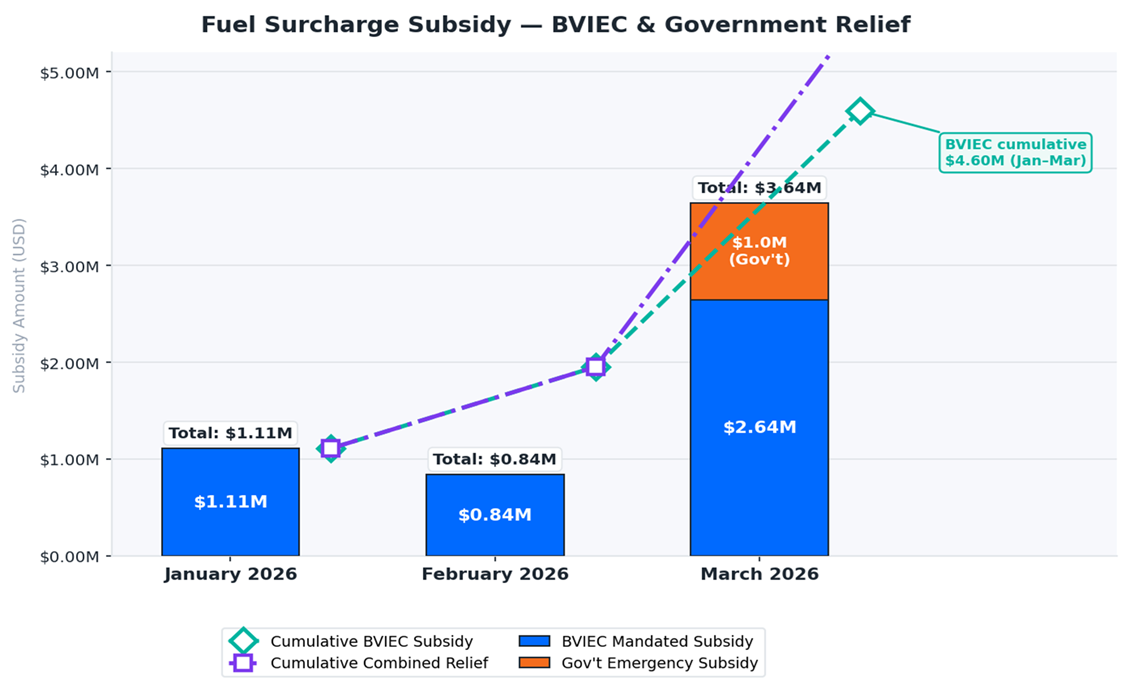
What it Means:
BVIEC absorbed $2,644,955.84 in fuel surcharge subsidies in March alone, more than double what was absorbed in January and more than three times February’s amount. The cumulative subsidy absorbed from January through March 2026 now stands at $4,597,351.94.
Additionally, the Government of the Virgin Islands stepped in with an emergency subsidy of $0.075305 per kWh, equivalent to approximately $1,000,000 for the month, covering 67% of the incremental surcharge gap above the 2025 peak. This percentage was calculated by dividing the Government’s $1,000,000 commitment by the highest monthly kWh sales recorded in 2025, creating a fair, proportional benchmark across all customer categories.
Why it Matters:
BVIEC’s fuel subsidy is not a business decision, it is a mandated obligation under electricity rates that have not changed since 1978. March exposed the full weight of that obligation. Absorbing nearly $2.7 million in a single month, on top of already-strained finances, is not sustainable.
Relatable Example:
BVIEC absorbed over $85,000 per day in fuel subsidy costs in March. Add the Government’s emergency $1 million contribution, and a combined total of over $3.6 million in relief was deployed in March alone to shield residents and businesses. That is the equivalent of over $116,000 in combined daily protection.